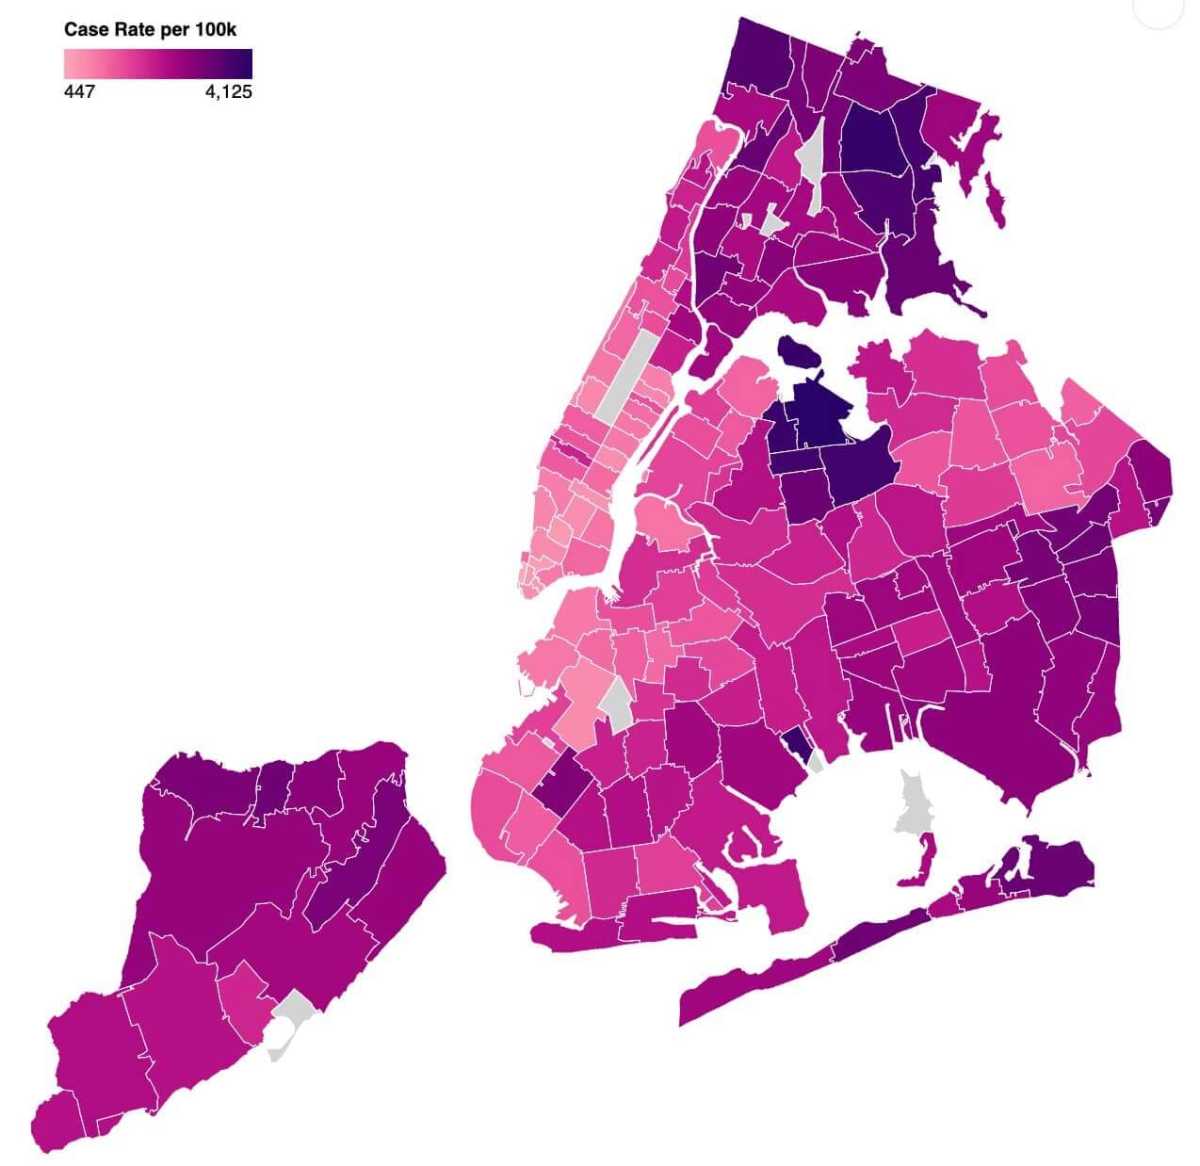
The Department of Health released new data on coronavirus infection broken down by zip code on May 18, offering the most detailed look yet at the spread of the virus — which has thus far hit Kings County harder than any other place in America.
The data is divided into overall cases, deaths, percentage of positive tests, and the case rate per 100,000 people.
The five areas with the most confirmed COVID-19 deaths are:
Zip Code |
Neighborhood |
Infections |
Deaths |
| 11236 |
Canarsie/Flatlands |
2,551 | 260 |
| 11235 |
Sheepshead Bay |
1,929 | 252 |
| 11226 |
Flatbush |
2,100 | 241 |
| 11203 | East Flatbush |
1,933 |
222 |
| 11212 |
Bed-Stuy/Crown Heights |
1,709 | 207 |
Because the population living in each zip code is different, the actual rate of deaths compared to population shows different hotbeds around the borough, with some overlap.
Notably, the 11239 zip code, which encompasses the Starrett City subsidized housing complex, leads the entire city with 612 deaths per 100,000 people. The neighboring 11236 zip code, which includes Canarsie and Flatlands has the most total deaths, but a lower death rate — 268 per 100,000 people.
Adjusted for population, the five areas with the highest death rate are:
Zip Code |
Neighborhood |
Infections/100,000 |
Deaths/100,000 |
| 11236 |
Starrett City |
3,891 | 612 |
| 11224 |
Coney Island |
2,430 | 416 |
| 11235 |
Sheepshead Bay |
2,425 | 317 |
| 11203 | East Flatbush |
2,634 |
222 |
| 11236 |
Canarsie/Flatlands |
2,634 | 268 |
While the areas with the most COVID-19 deaths and the highest mortality rates tended to be located in southern Brooklyn, the areas with the lowest amount of deaths were all located in the northern half of the borough.
The five areas with the lowest total deaths are:
Zip Code |
Neighborhood |
Infections |
Deaths |
| 11222 |
Greenpoint |
415 | 26 |
| 11231 |
Red Hook |
395 | 33 |
| 11232 |
Sunset Park |
490 | 37 |
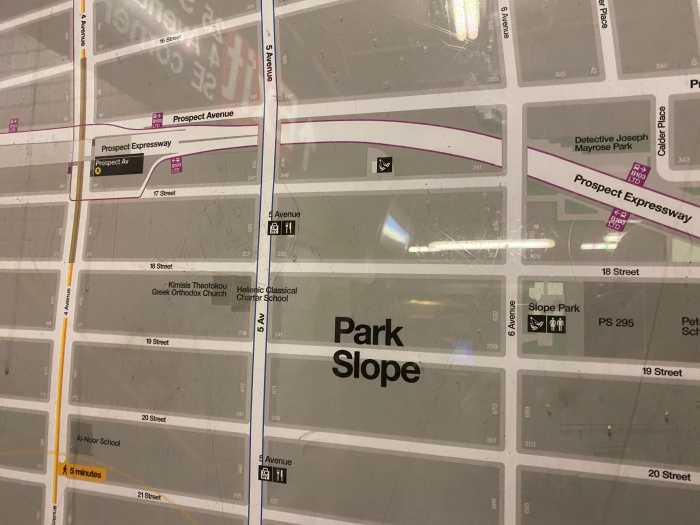
| 11215 | Park Slope |
587 |
40 |
| 11205 |
Clinton Hill |
679 | 44 |
The trend toward a lower COVID-19 toll in northern Brooklyn also holds up when adjusted for population, as the five zip codes with the lowest death rate are:
Zip Code |
Neighborhood |
Infections/100,000 |
Deaths/100,000 |
| 11215 |
Park Slope |
839 | 57 |
| 11222 |
Greenpoint |
1,142 | 72 |
| 11231 |
Red Hook |
89 | |
| 11205 | Clinton Hill |
1,543 |
100 |
| 11216 |
Bed-Stuy/Crown Heights |
1,235 | 106 |
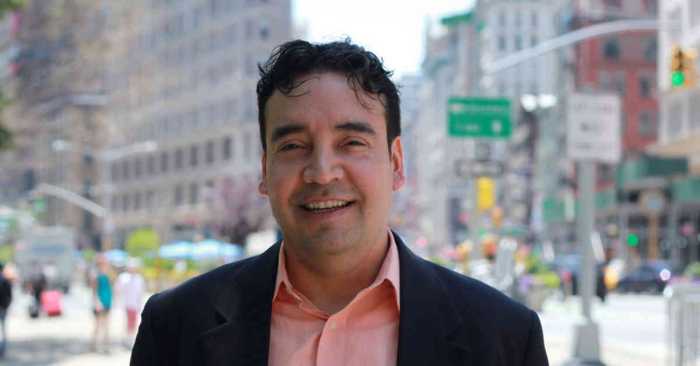
Coney Island Councilman Mark Treyger said he was “devastated” and “outraged” by the statistics, claiming that the higher death rate in his district was because the city was slow to get them with the same resources that other neighborhoods were given.
“If you know Coney well, you know it’s basically a small town. People know each other and families have roots here for generations, which is what makes this all the harder. We may not have the density of Manhattan, but deaths reverberate here in a way that they don’t in many parts of the city,” Treyger said in a statement. “What I cannot reconcile is how hard we have had to fight for the smallest scraps, knowing that our demographics put us at higher risk of death, when there were parts of the government who had the data that demonstrated what we knew anecdotally: our community was being decimated.”
In examining the outsized impact of the virus on minority communities, Manhattan Councilman Mark Levine, who chairs the council’s health committee, said the data confirmed what many had already suspected about the link between wealth and access to quality health care.
“[The data] confirms dramatic inequality, with death rates in low-income communities of color more than 10 times greater than wealthier areas,” the pol wrote on Twitter. “This should shock the conscience of our city.”
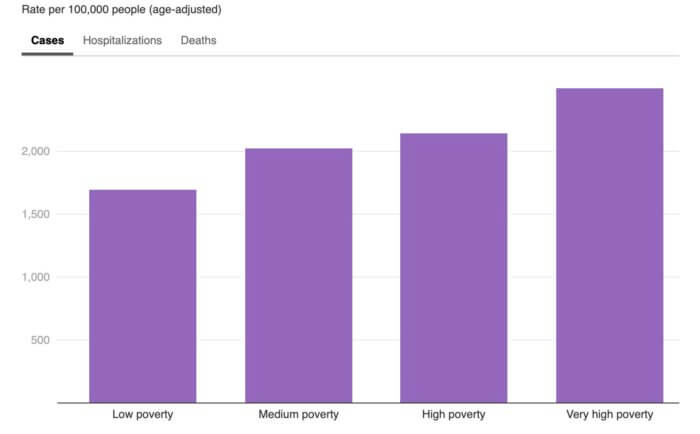
The data, when broken down further, shows that those living with “very high” poverty are more than twice as likely to die as those living with “low” poverty.
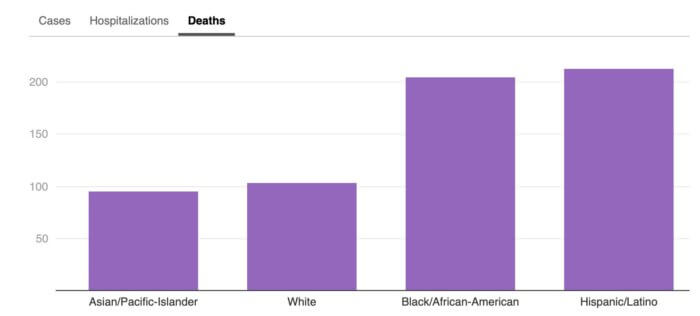
Black and Hispanic New Yorkers also have the highest death rates according to the data, which shows non-white or Asian people are twice as likely to die from the virus.
State Senator Roxanne Persaud, whose district encompasses Starret City, as well as Canarsie and East New York, said she wasn’t surprised by the numbers.
“It’s a distressing situation and we knew there were shortcomings across the district,” Persaud said, “so when [coronavirus] hit, it was no surprise certain areas hit hard. The density, limited resources we’ve been working with — we’ve known for a while so the numbers are not news to us.”
Persuad said this isn’t the first time her district, home to 19 public housing developments, has been overlooked.
“The minority community shouldn’t be suffering like this,” she said. “It reminds of Hurricane Sandy — when Canarsie was hit, no one saw the mass destruction so it’s the same thing with this.”
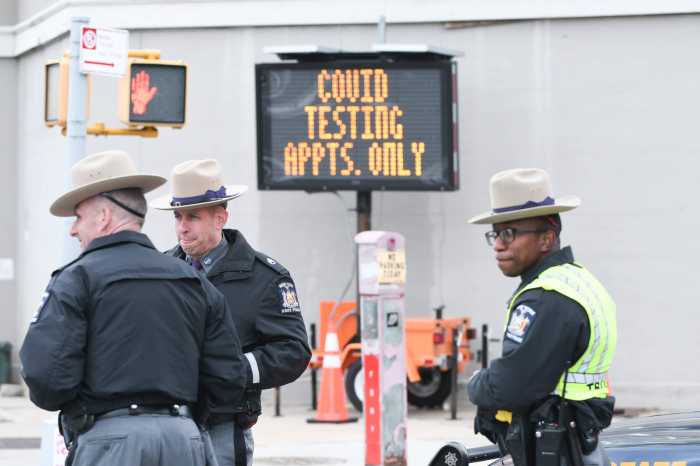
The data represents the most up-to-date information available as recorded by the Department of Health. Throughout March and April, the city only had the capacity to test those with severe symptoms, which the data represents.
In May, the city has beefed up its testing capabilities and is now operating 150 testing sites across the city with some centers accepting walk-ins, though some neighborhoods still have limited access to testing — ultimately affecting the data.
Additional reporting by Todd Maisel