Parents all over Brooklyn were no doubt scratching their heads over the city’s new progress report cards — “How could PS 107 get an ‘A’ while PS 321 got a ‘B’?” some Park Slope parents muttered; “And what’s with that ‘C’ for PS 8 in Brooklyn Heights?” others groused — but the grades should not be taken as the final word on school quality, the Department of Education said this week.
Rather, the grades reflect a combination of school environment, student achievement, and student progress, which determines 55 percent of the grade and measures yearly gains in reading and math.
The reason some schools didn’t receive as high a grade as expected is because so much weight is given to a school’s increase in test scores.
So already excellent schools like PS 321 don’t get as many points for serving top students well year after year.
Instead, schools are more rewarded for raising the scores of students in the bottom third of their school, according to Andrew Jacob, a spokesman for the Department of Education.
See the accompanying charts for an overview, but to get the full breakdown for your school, visit the schools.nyc.gov“>Department of Education Web site.
Brooklyn Heights and Downtown
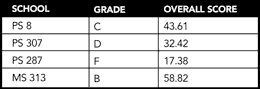
Brooklyn Heights and Downtown didn’t fare too well in the city’s brand-new comprehensive progress report system, with just one of the neighborhood’s four elementary and middle schools receiving a B, far below the citywide average of 60 percent. Also noteworthy is the C grade given to PS 8 — which most people in the neighborhood thought had turned a corner thanks to beloved principal, Seth Phillips. PS 287 in Downtown received the only failing grade in all of Brownstone Brooklyn, Williamsburg, Greenpoint, Bay Ridge and Bensonhurst. Source: Department of Education
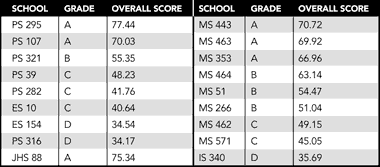
Bay Ridge
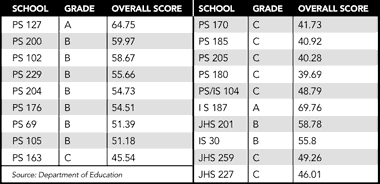
Bay Ridge didn’t fare too well in the city’s brand-new comprehensive progress report system, with just two of the neighborhood’s 19 elementary and middle schools receiving A grades (11 percent). That’s less than half as good as the citywide average of 23 percent. In addition, only eight schools got B grades, meaning that only 53 percent of the schools got A or B marks — a good 10 percent less than the citywide average. On the bright side, local celebrity Lorraine Bracco, who played Dr. Melfi on “The Sopranos,” has cause to be proud: her alma mater, PS 127, received an A. Source: Department of Education
Carroll Gardens, Cobble Hill and Red Hook
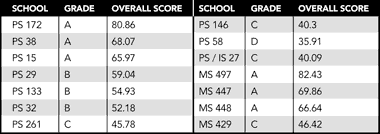
Schools in Carroll Gardens, Cobble Hill and Red Hook fared exceptionally well in the city’s brand-new comprehensive progress report system, with 43 percent of the area’s 14 elementary and middle schools receiving A grades (as compared to 23 percent citywide). Interesting historical note: PS 15 in Red Hook — also known as the Patrick F. Daly School after the beloved principal who was shot in front of the institution in 1992 — got an A. Source: Department of Education
Fort Greene and Clinton Hill
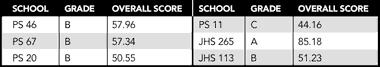
Fort Greene and Clinton Hill fared pretty well in the city’s brand-new comprehensive progress report system, with five of the area’s six elementary and middle schools receiving grades of B or better (far better than the citywide average of 61 percent). The best news is that JHS 265, which serves the Walt Whitman and Farragut houses, got the best overall score — 85.18 — of any school in Brownstone Brooklyn, Williamsburg, Greenpoint, Bay Ridge and Bensonhurst. Source: Department of Education
Park Slope
Park Slope didn’t live up to its reputation as bastion of excellent education in the city’s brand-new comprehensive progress report system. Just 55 percent of the neighborhood’s 18 elementary and middle schools received grades of B or better (compared with 61 percernt citywide). On a more positive note, one-third of the schools received an A — beating the citywide mark of 23 percent. Even more surprising, the neighborhood’s much-vaunted PS 321 actually got a B, while the up-and-coming elementary school, PS 107, got an A. Source: Department of Education
Williamsburg and Greenpoint
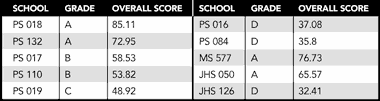
Williamsburg and Greenpoint didn’t fare too well in the city’s brand-new comprehensive progress report system, with just half of the neighborhood’s 12 elementary and middle schools receiving grades of B or better (well below the citywide average of 61 percent). Interestingly, PS 18, which was rocked by racial tensions in 2006, received the best overall score in the area. Source: Department of Education